Business Intelligence & Analytics
We Deliver Data, Powerhouse Analytics, and Modern Data Visualization Tools That Offer You Access to Spend and Trends
Take a deep dive into your shipping and transportation data with the help of Shipment Trackers. Our online, interactive dashboards set on your supply chain data allow you to quickly identify the trends, successes, and areas for improvement. We provide a fully customizable business intelligence and analytics solution that can enhance your data visualization. Our online dashboards can deliver hundreds of data points through simple tables, charts, maps, or more advanced forecasting models, such as mean comparison and correlation and regression analysis.
This fully customizable solution offers interactive dashboards designed to meet your specifications. Custom reports can be sent directly to the recipients of your choice. With Shipment Trackers, you can get the expertise of a business intelligence analyst who can handle all your transportation needs.


What Information Can You Access Via the Shipment Trackers Online, Interactive Dashboard?
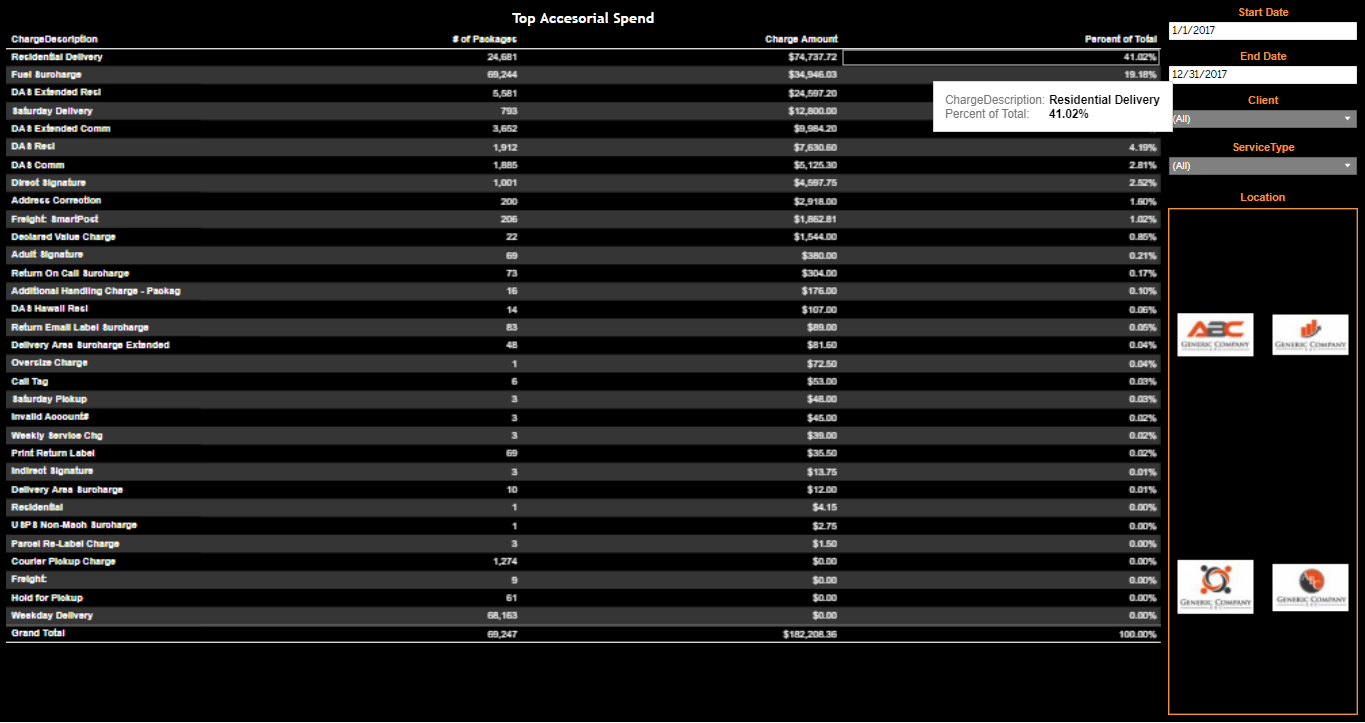
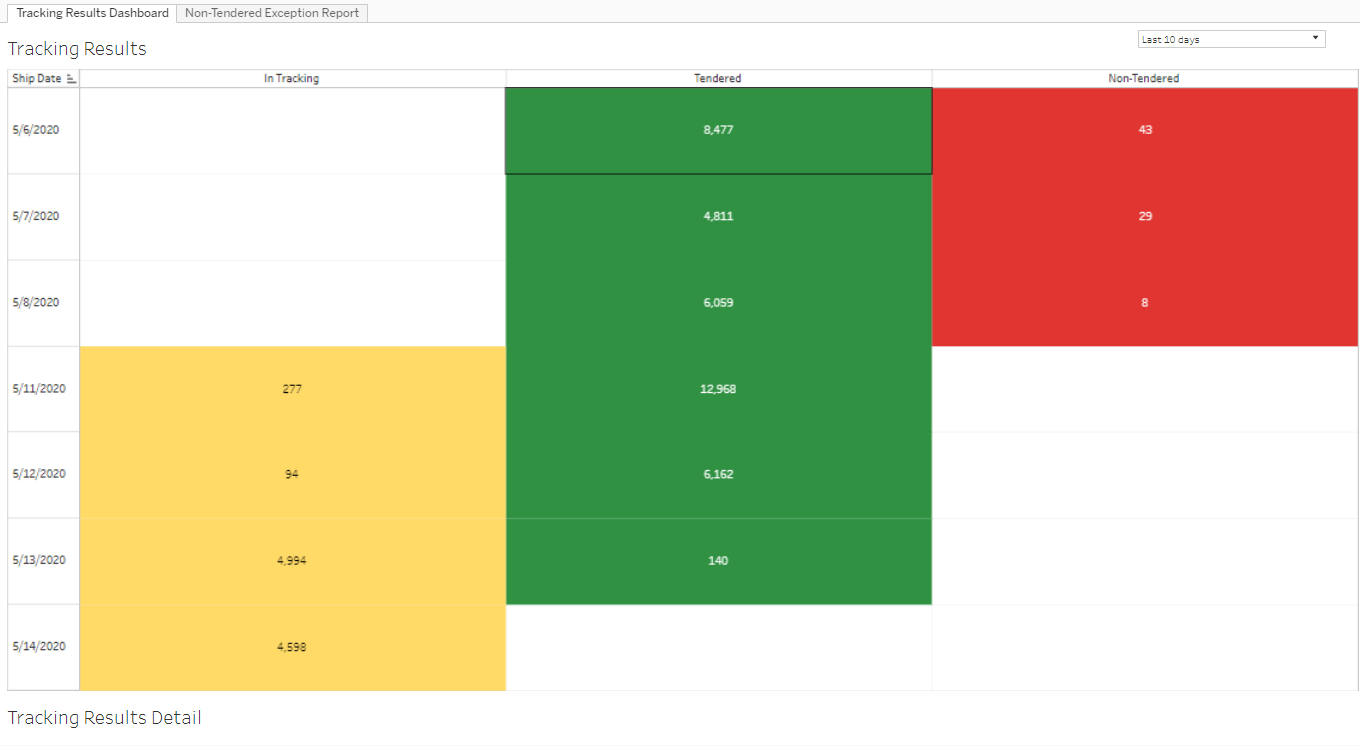
Use our online, interactive dashboards to visualize key aspects of your shipping costs. Clickable icons, filters, customizable parameters, and hundreds of data points allow users to view chart-detailed shipment information. Drill down functionality allows users to access the underlying data to answer questions about trends and outliers alike. Through our interactive online dashboards, you can access the following data types:
- Carrier invoice data
- Carrier package scan and location data
- Aggregated data, such as average cost per package and average weight per shipment
- Carrier list rates, accessorial costs, and fees
- Measurable data, such as total weight, actual weight versus rated weight, and package counts
- Descriptive data, such as service levels; zones; shipping, delivery, and invoice dates; carrier information; and package attributes
- Geographic and address data

What Are Some of the Features Accessible Through the Shipment Trackers Interactive Dashboard?
- Whether displayed graphically or in tabular form, all data can be easily exported to Excel or saved as images that can be embedded into a presentation or shared via a PDF
- Display or group your data by any metric you desire
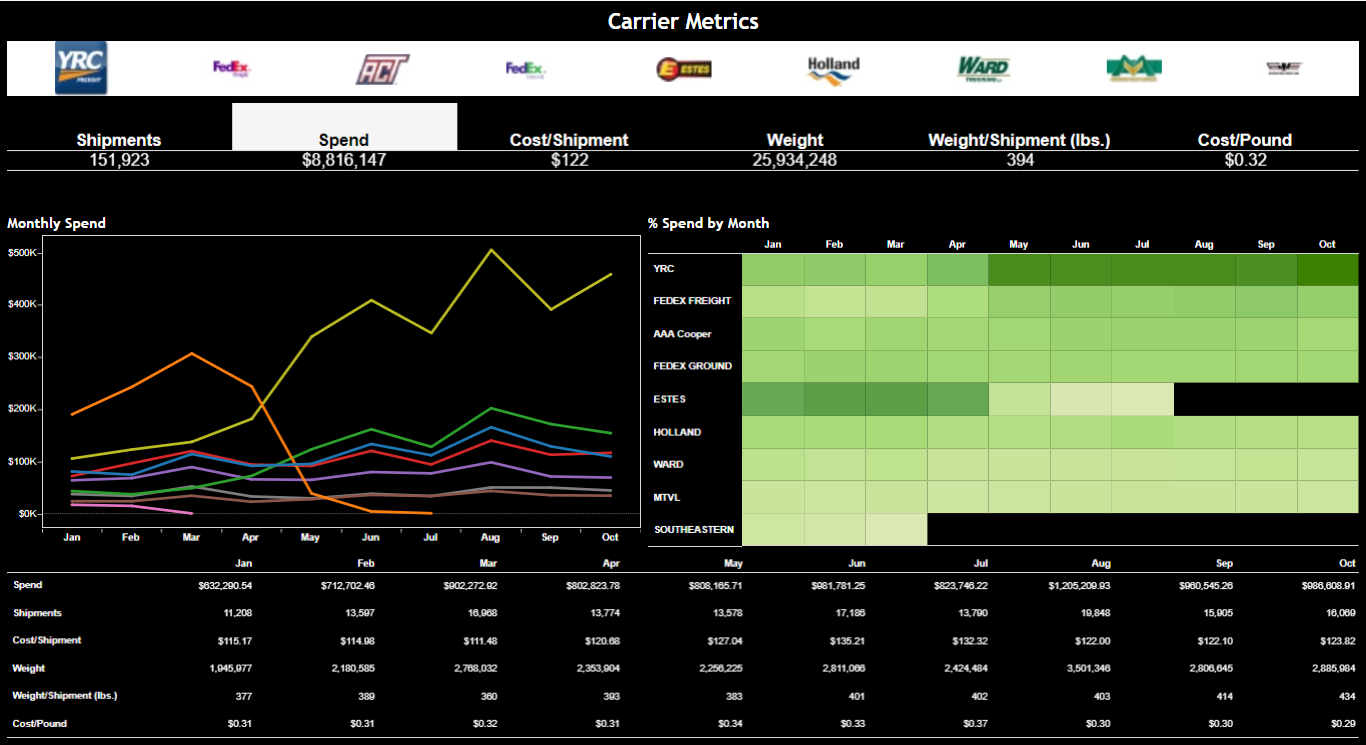
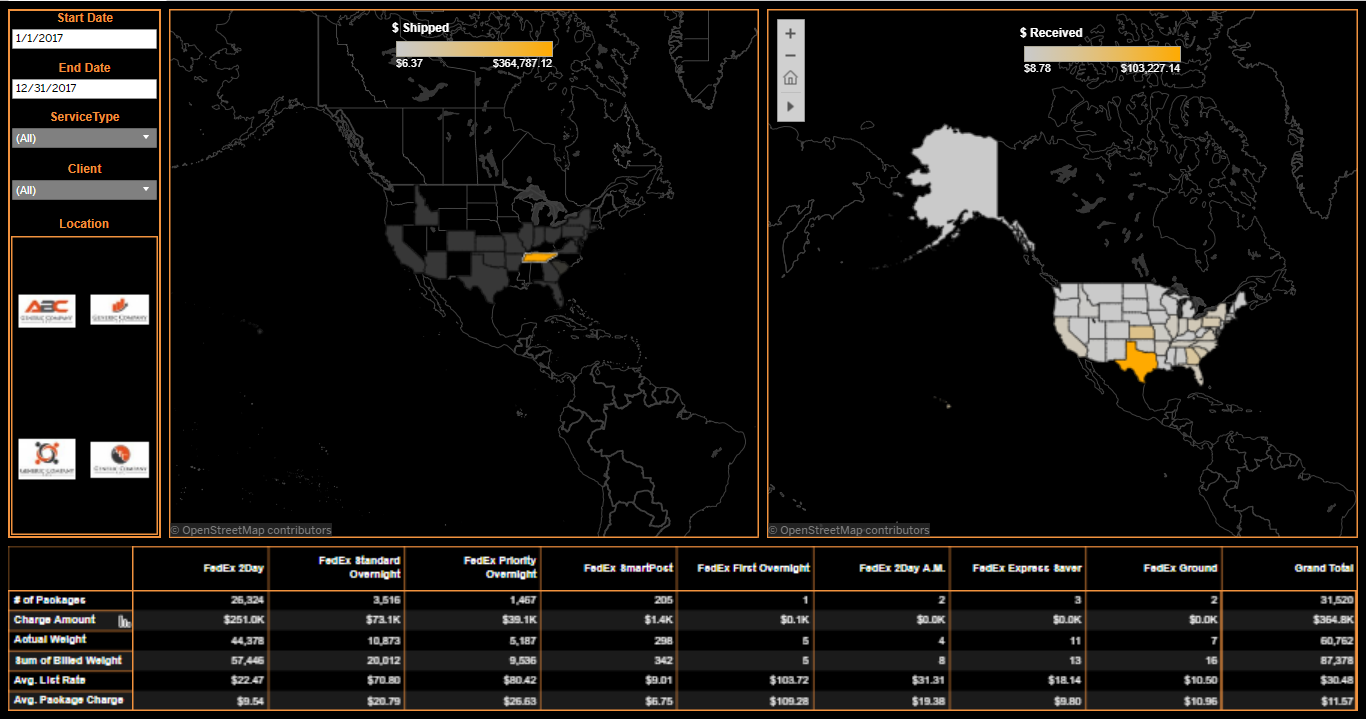
- Visualize your transportation spend over time by week, month, year, etc.
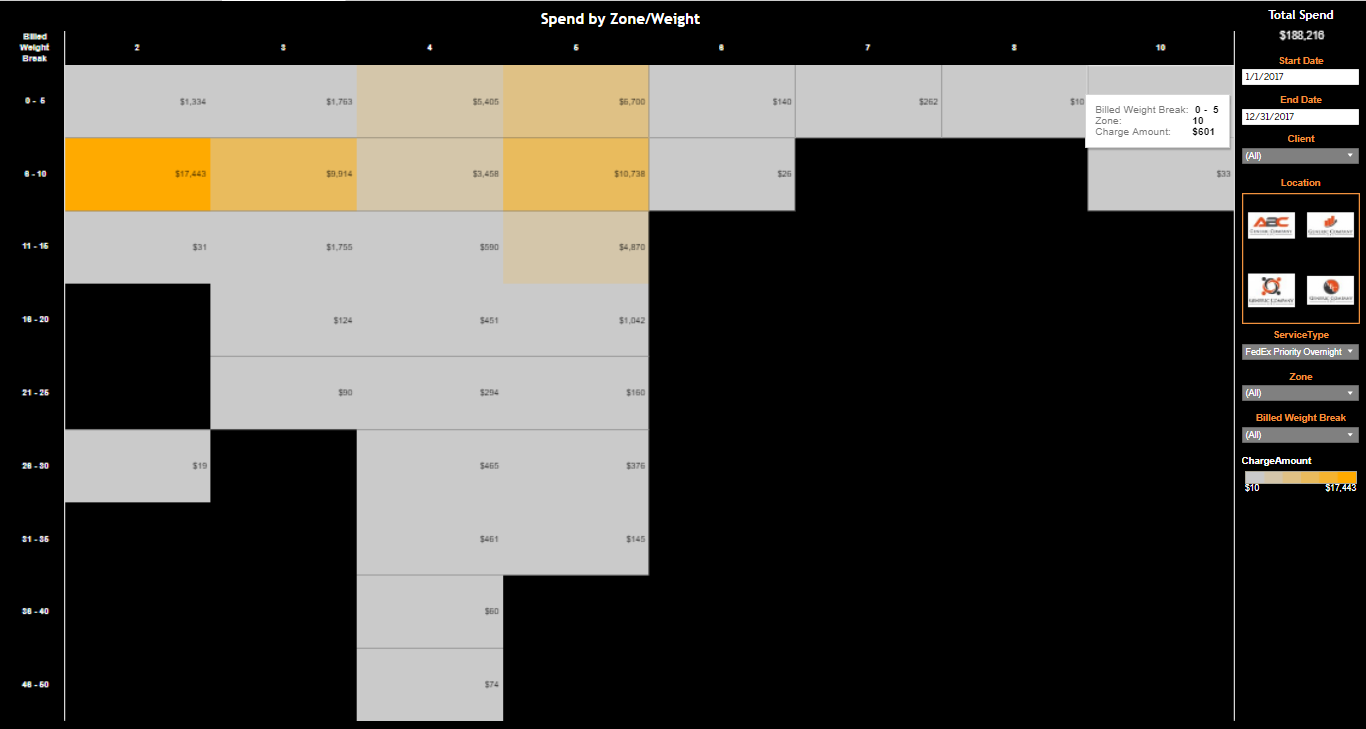
- Outline package counts by service type and zone
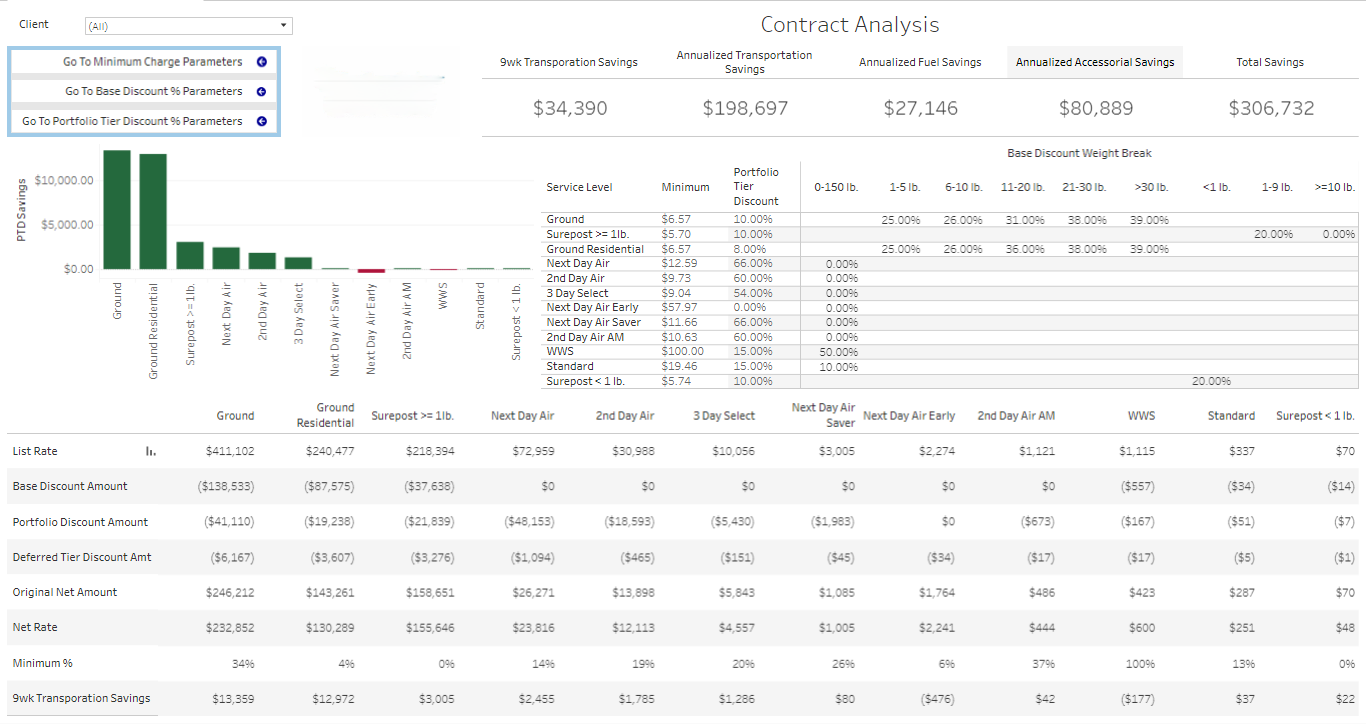
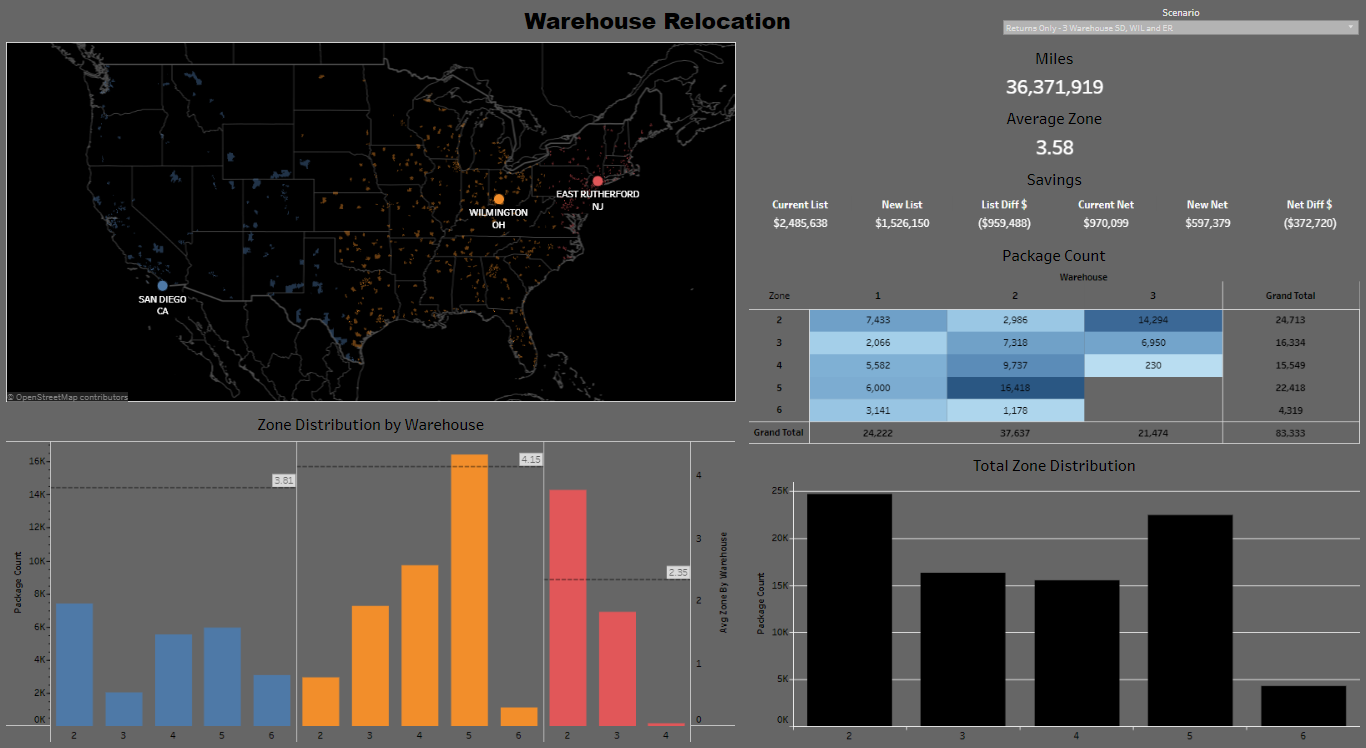
- Create data visualizations from the simple—tables, bar, and pie charts—to complex maps or advanced models for forecasting, means comparison and correlation, and regression analysis
When you take a deep-dive approach to your data with Shipment Trackers, you can identify patterns or differences among carriers, regions, and service levels.
View a demonstration of the Shipment Trackers Client Dashboard anytime! Feel free to email us at sales@shipmentrackers.com.

Are Customizable Reports and Dashboard Visualizations Available?
We welcome those clients who want to take a deeper dive into their data and require customized reports and online dashboards. The cost for this enhanced level of customization is based on the scope of the request from the client. Better yet, ask us how this could be complimentary for you.
Don’t see your data in the format you’d like? We’ll gladly build a fully customizable reporting solution at our enhanced service level.

Let Us Find the Money for You
Contact Shipment Trackers to learn more about our business intelligence and analytics services.